EMPOWER Santa Barbara

Wildfire preparedness survey results

Results from households across Santa Barbara County.

319 respondents151 FireWise168 non-FireWiseOverview
Take the survey
Survey overview1 / 8

Who took part, and what the survey found

At a glance

The survey includes 319 respondents: 151 FireWise community members and 168 non-FireWise respondents.

Respondents were predominantly older adults, and most of those answering the insurance questions reported having fire insurance. Renter representation was limited. Household and demographic measures are shown with the number of people who answered each question.

Respondents319all records
FireWise1516 reclassified by boundary/date rule
Average age61.1age-bracket midpoint estimate
Households with children72household roster
Renters5.4%n=74
Fire insurance94.5%n=55
Uses gardener67.5%n=77
English comfortable100.0%n=274
Explore chart
Note. Select a legend item to hide or show a group. Sample sizes: FireWise n=151; non-FireWise n=168; total n=319. Source: EMPOWER Santa Barbara Wildfire Preparedness Survey.
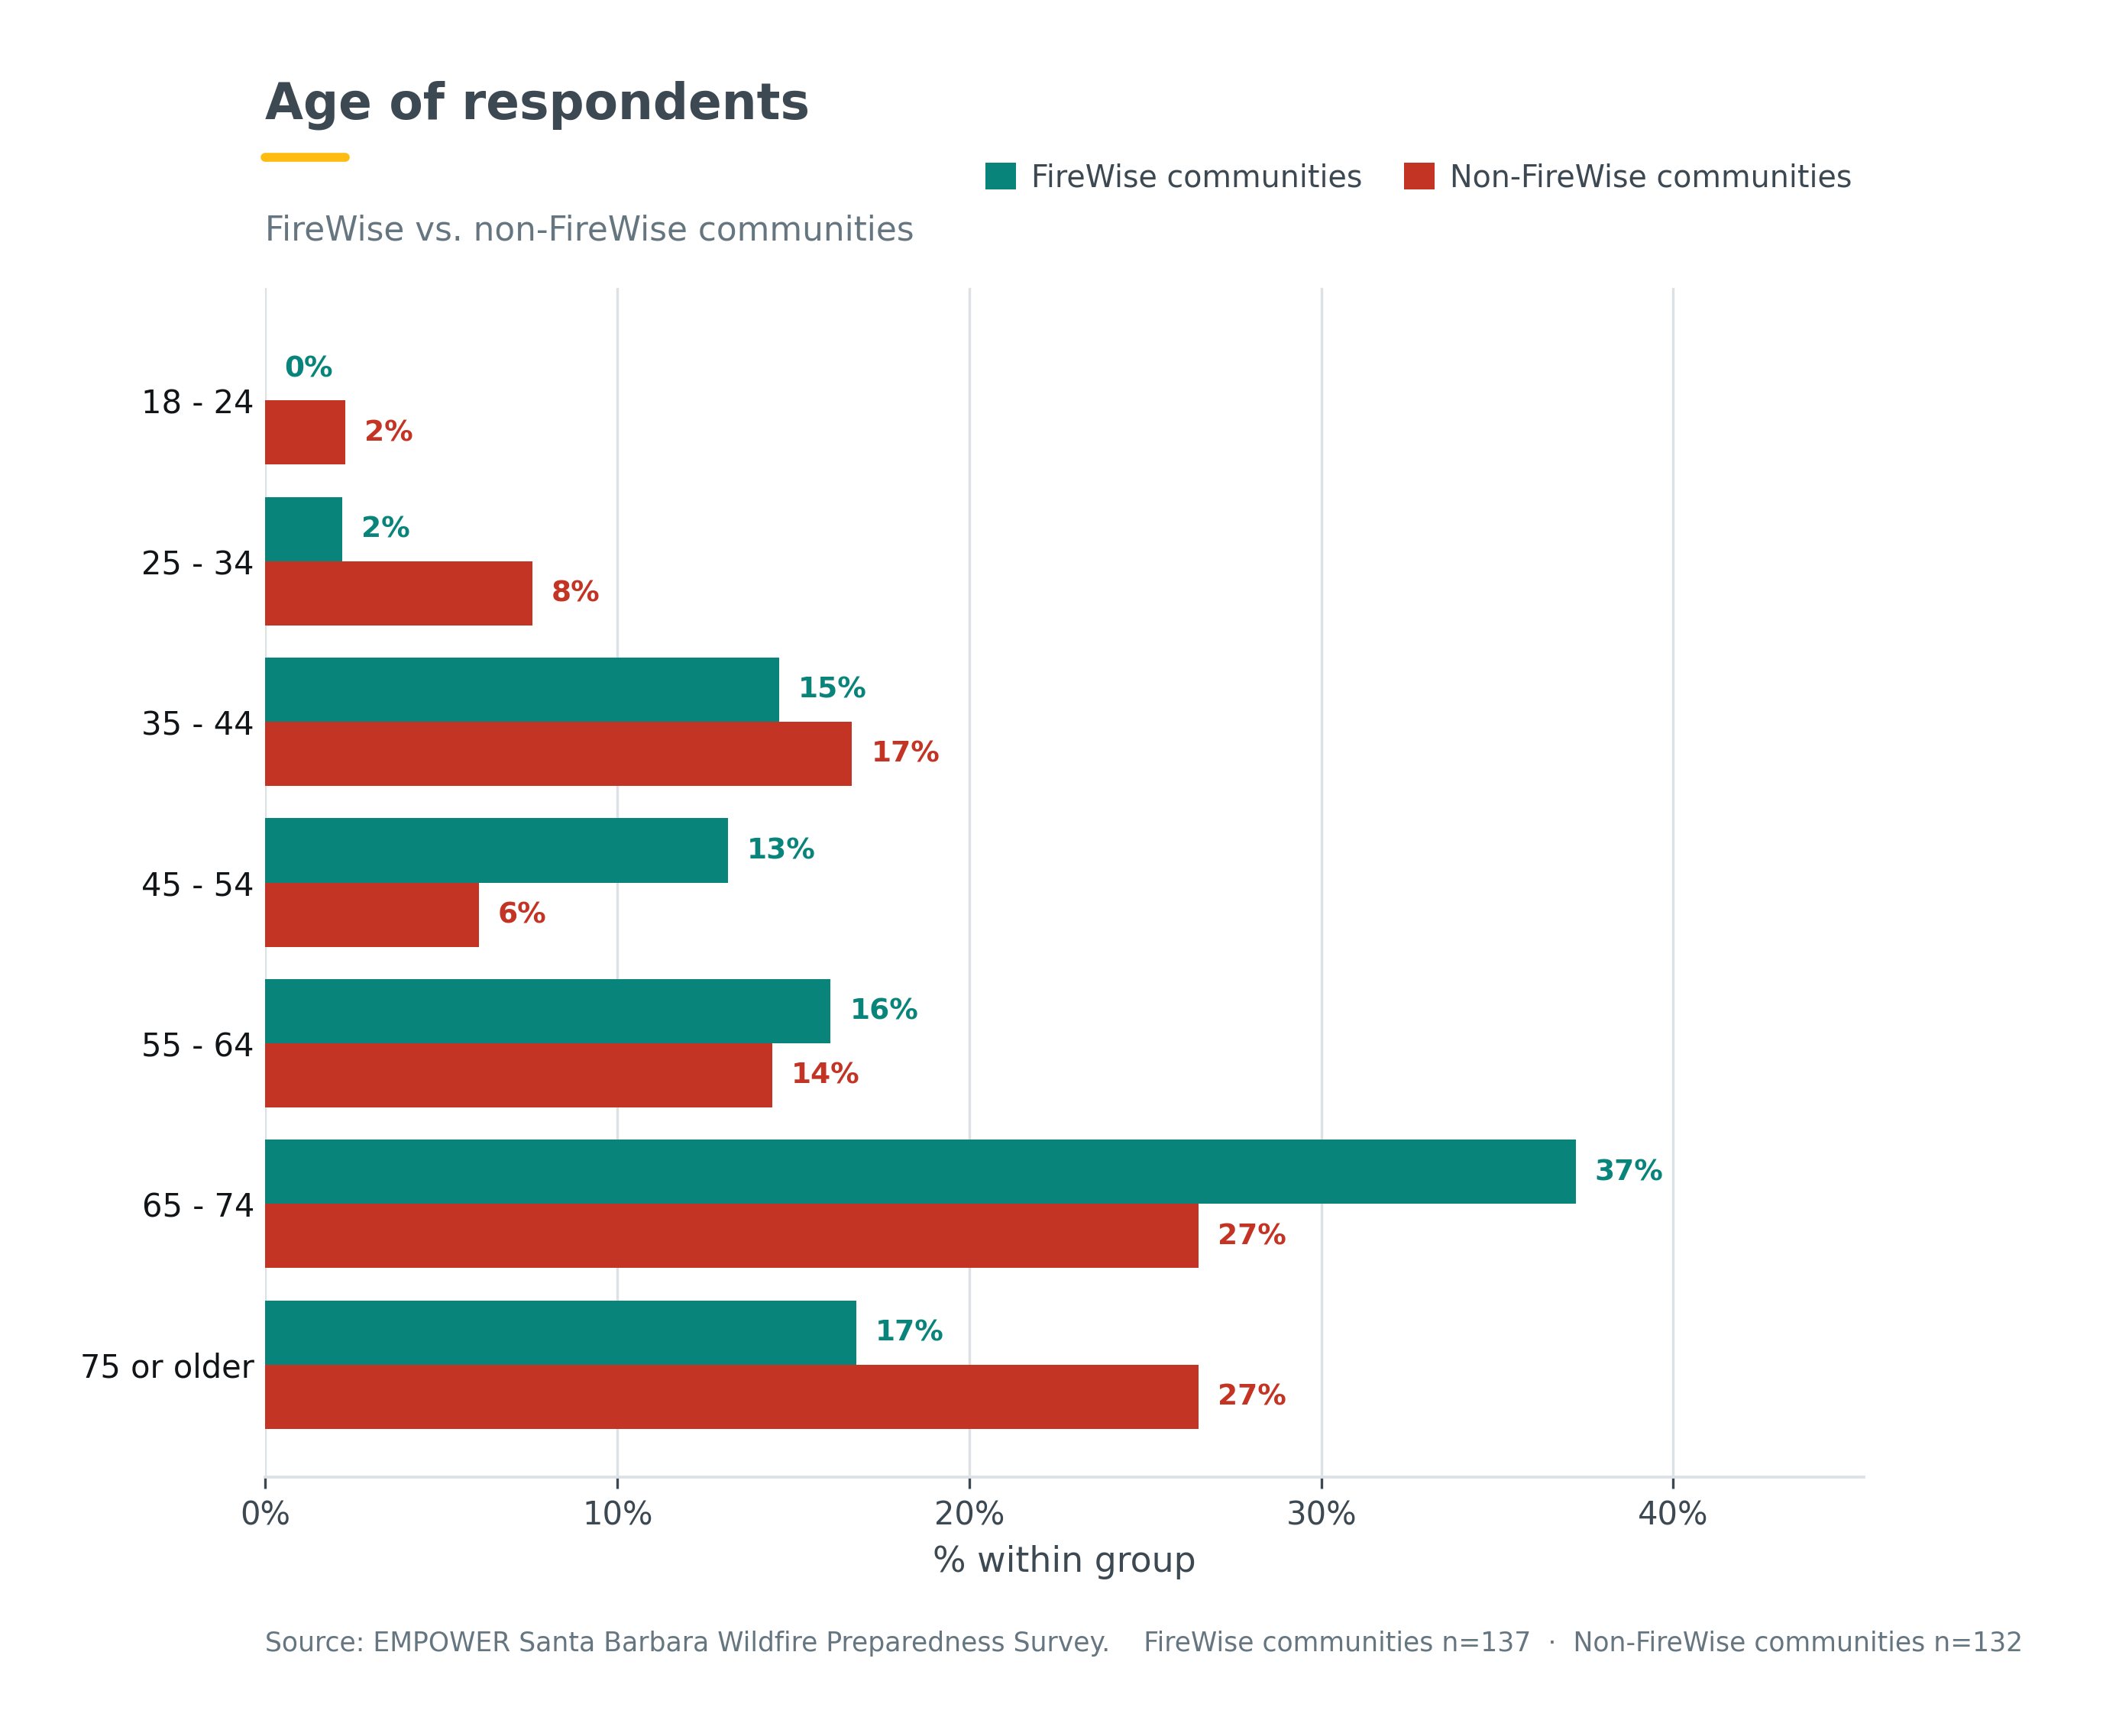
Age distribution by FireWise status
Note. Age distribution by original survey brackets.

The respondents represented a broad mix of communities, but the sample leaned toward older, English-speaking homeowners. Insurance coverage was common among those who answered those questions, while renters and households without insurance were represented by much smaller numbers.

Current FireWise communities in Santa Barbara County

Survey response totals are presented for each community.

Interactive map

Survey responses by FireWise community.

Survey response totals are grouped as 0, <5, <10, or 10 or more to protect respondent privacy.
Survey responses by current FireWise community
CommunityDate awardedSurvey responses
Tecolote Canyon (Rancho Embarcadero)January 202310 or more
Maria Ygnacia CreekJune 202210 or more
San Antonio CreekJanuary 202310 or more
Rattlesnake Canyon- Las CanoasFebruary 2025<10
Northridge RdAugust 2023<10
Santa Barbara HighlandsApril 2023<10
Painted CaveApril 2023<10
Westwood OaksFebruary 2025<10
Eucalyptus Knolls HOAJuly 2024<5
MCA-Upper Tunnel RoadSeptember 2022<5
Montecito NorthApril 2025<5
Sunrise Village HOADecember 2024<5
West Camino CieloMarch 2024<5
Jonata Springs Ranch HOAMay 2024<5
Las Canoas, Foothill, and Tierra Cielo LanesMarch 2025<5
San Marcos Trout ClubFebruary 2022<5
Winchester Commons HOAFebruary 2026<5
Hollister RanchMarch 2022<5
Las TunasFebruary 2026<5
Park HighlandsMay 2026<5
Serena Park (Ocean View Ave)August 2025<5
West MesaNovember 2025<5
Cima LindaAugust 2024<5
EH-Coronada CircleApril 2024<5
Hideaway HOAMarch 2026<5
Hope RanchAugust 2025<5
Las Canoas-El CielitoFebruary 2026<5
MCA-Arriba WayDecember 2023<5
MCA-Upper Mission Canyon RdApril 2023<5
Montecito SouthApril 2025<5
Rancho Santa Rita Estates - CebadaNovember 2022<5
Rosario ParkDecember 2024<5
Sycamore CanyonJanuary 2025<5
The Bluffs (Ellwood Mesa)February 2025<5
Upper Toro CanyonFebruary 2025<5
Via ChaparralApril 2025<5
Vista De Santa BarbaraJanuary 2025<5
Alisal RanchAugust 20250
Arroyo QuemadaFebruary 20260
Arroyo Verde CondosOctober 20250
Beachwalk CondosAugust 20250
Calle Communtihy (Elings Park)April 20250
Cathedral Oaks EstatesJune 20250
Cathedral Oaks Village AssociationFebruary 20260
Cielito HOAMarch 20250
Coyote CircleMarch 20260
De La Guerra HeightsFebruary 20260
EH-Deerpath RoadJuly 20250
El Capitan Ranchos AssociationApril 20250
Eucalyptus Knolls Homeowners Association (EHHA)April 20250
Evergreen Terrace EastMay 20260
Fred's PlaceJanuary 20260
Fredensborg CanyonMarch 20250
La Colina OaksJuly 20250
La Colina ParkSeptember 20250
La Colina Village Owners AssociationAugust 20250
Las Barrancas Owners's AssociationJune 20250
Los Robles IIOctober 20250
MCA-Montrose PlaceMarch 20240
MCA-Tornoe RoadSeptember 20250
Mission Ridge - RivieraMarch 20260
Oak Trail EstatesMarch 20260
Oak Trail Ranch HOAApril 20260
Palos Verdes DrJuly 20260
Patterson OaksOctober 20240
Rancho Del CiervoJuly 20250
Rancho La GoletaApril 20250
Riviera SummitJuly 20250
Santiago Hills HOAOctober 20250
Shadow Hills HOADecember 20240
Summerland Cottages HOAFebruary 20260
The BouldersMay 20250
Torito RoadMay 20250
Valle VerdeOctober 20250
Village Green HOAApril 20260
West Eucalyptus Hill - East APSSeptember 20250
Woodstock RanchMarch 20250
Note. Survey response totals are privacy-protected as 0, <5, <10, or 10 or more. Source: EMPOWER Santa Barbara Wildfire Preparedness Survey.

Take the EMPOWER Santa Barbara survey

Share your household and neighborhood wildfire-preparedness experiences to help inform local research, outreach, and community programs.

Take the survey

Overall survey key takeaways

Preparedness

Back-up important documents was the most commonly reported preparedness activity (72.4%).

Property action

Housekeeping (debris removal) was the most commonly reported home-hardening or maintenance improvement (75.0%).

Risk

Perceived lifetime wildfire impact averaged 4.03 out of 5.

Community capacity

A local wildfire-preparedness discussion group was reported by 49.3% overall, with a substantial FireWise/non-FireWise difference.

Defensible space2 / 8

Defensible space around the home

Defensible-space measures DefinitionReported actions that reduce combustible fuels around the home. Why it mattersReducing fuels can limit pathways for wildfire and embers to reach structures. How it was measuredSurvey responses to specific Zone 0, 1, and 2 actions and maintenance questions.
Key result

Respondents reported a mix of completed defensible-space actions across the three zones. Vegetation management received an average perceived-effectiveness score of 4.41 out of 5.

Defensible space reduces the fuels that can carry wildfire toward a structure. The results below pair the recommended activities for each zone with the specific actions reported by survey respondents.

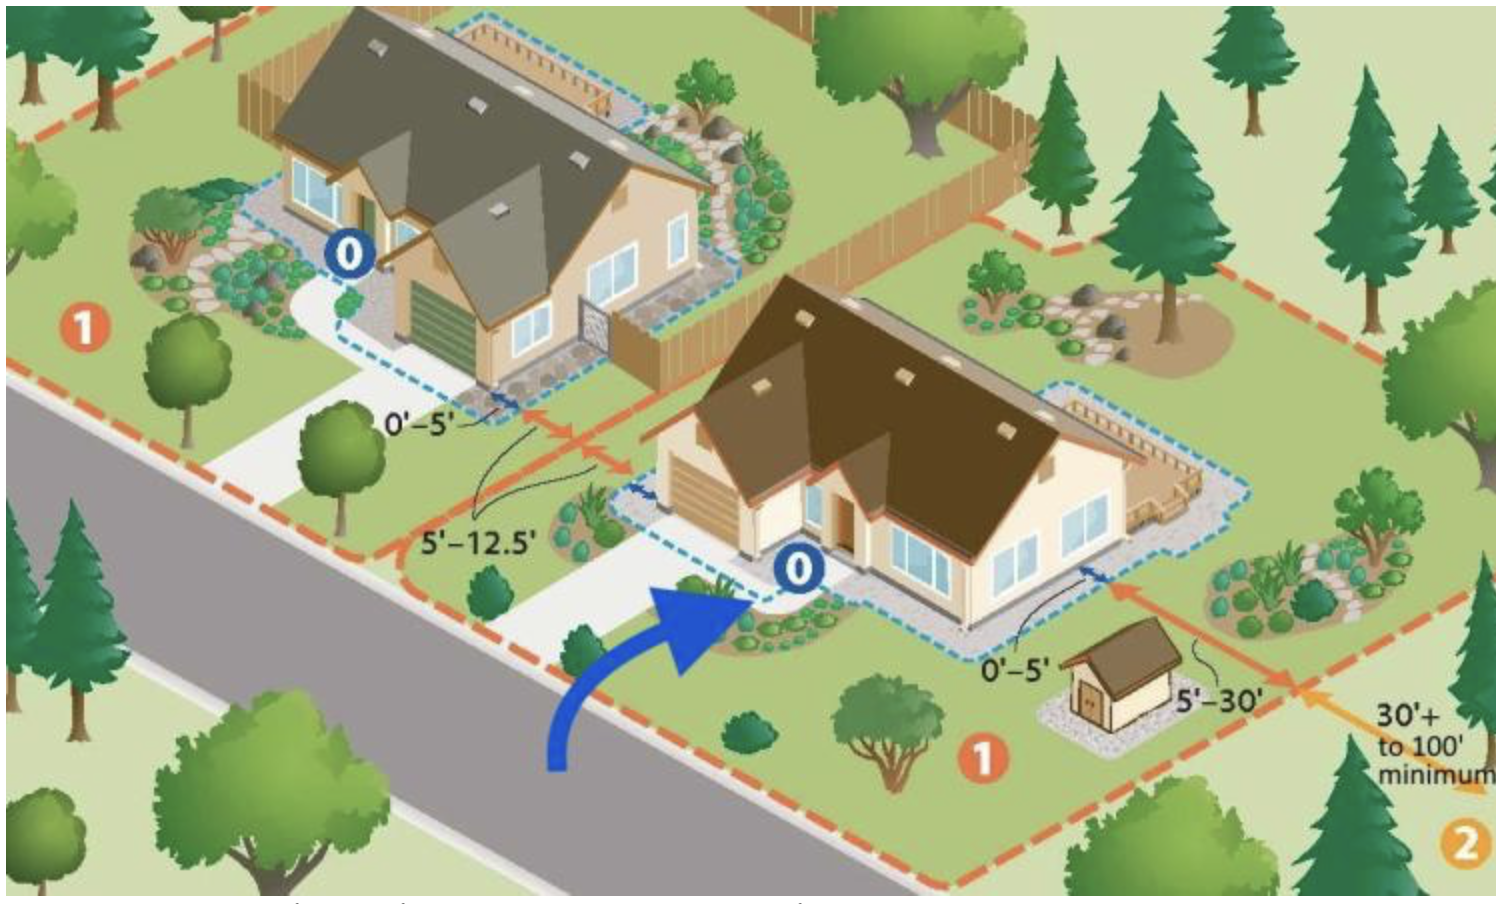
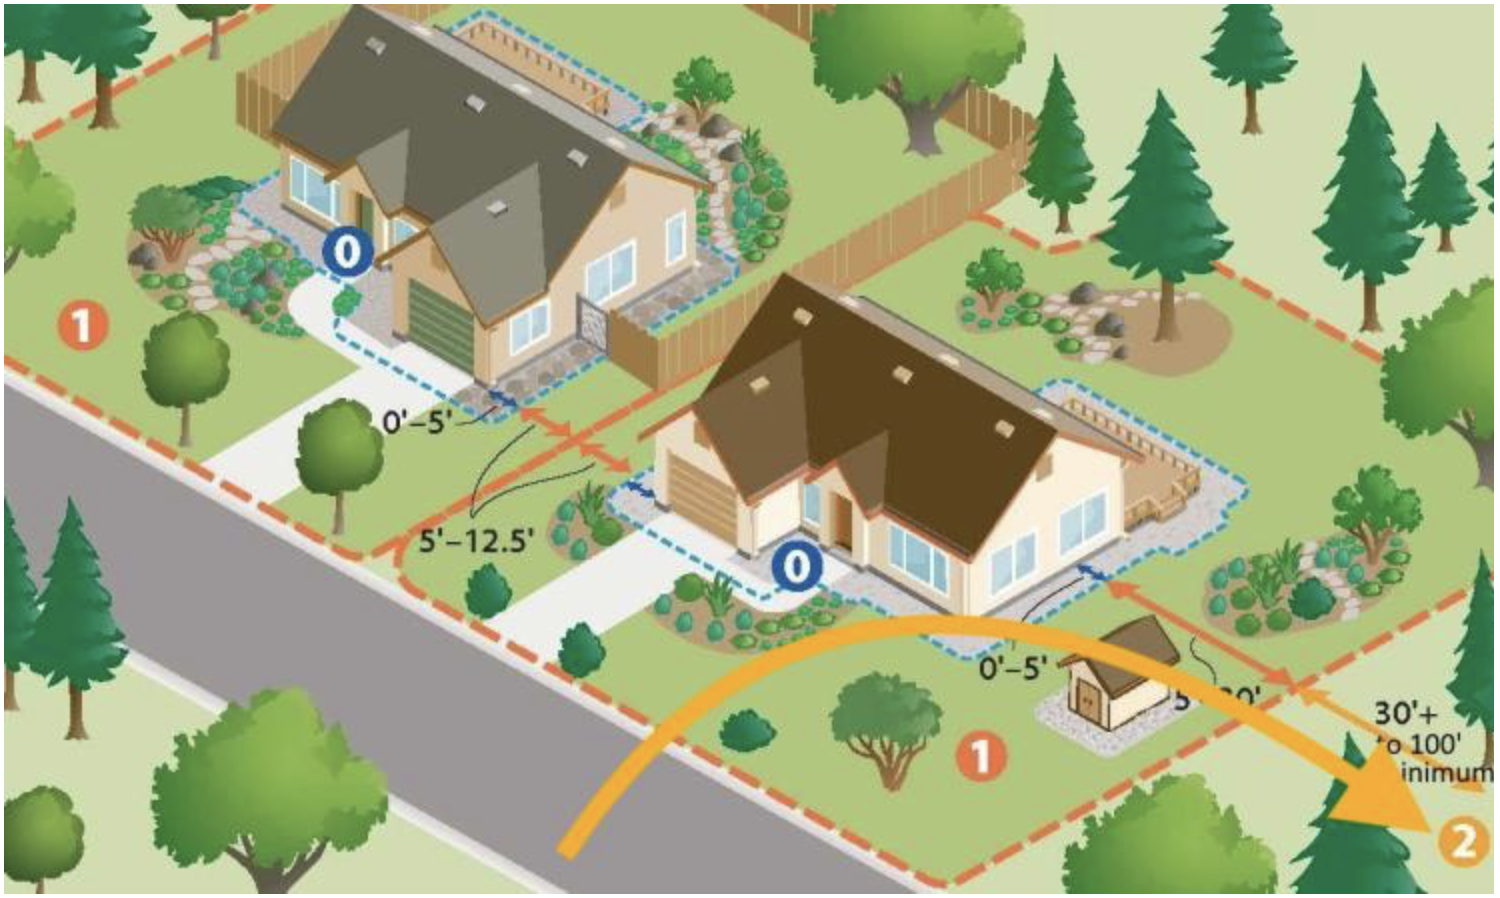
Zone 0 · 0–5 feet

The area immediately next to the home

Zone 0 activities include removing dead plant material from roofs, gutters, decks, and the ground; removing live plants and other combustible materials; removing branches that enter the zone; and using non-combustible ground covers such as gravel, stone, or pavers.

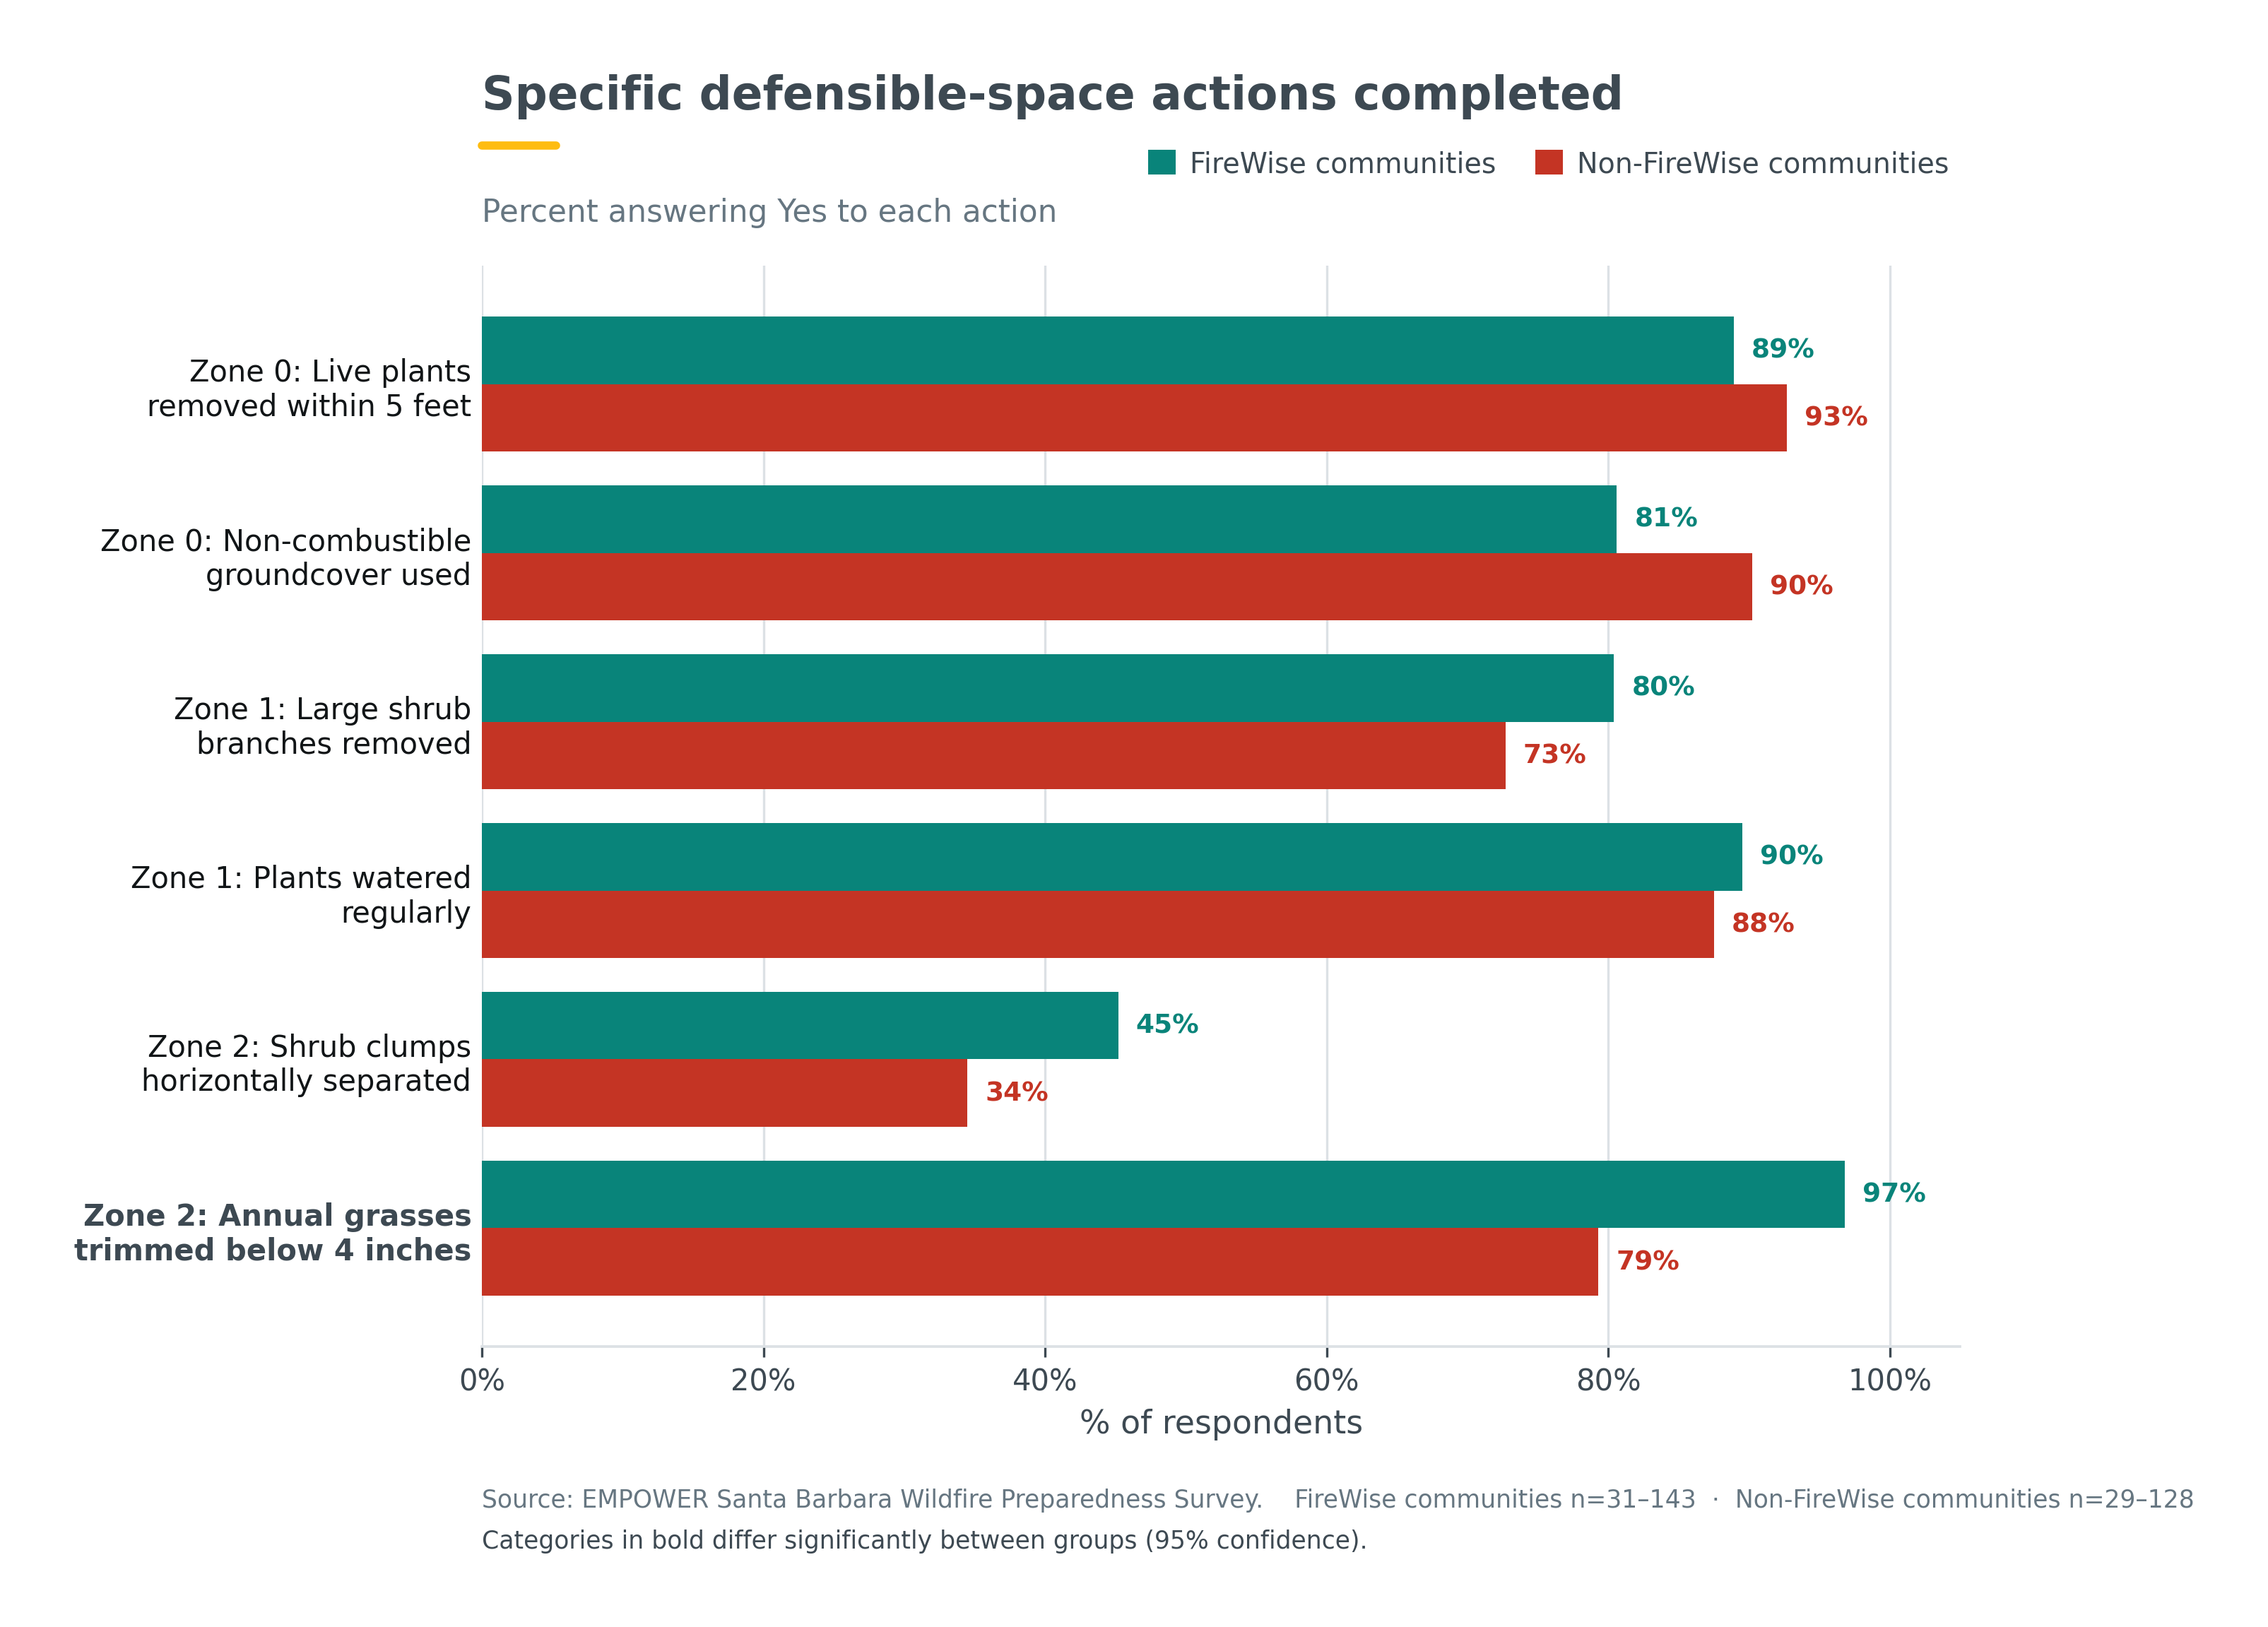
Live plants removed within 5 feet90.9%n=77 answering
Non-combustible groundcover85.7%n=77 answering

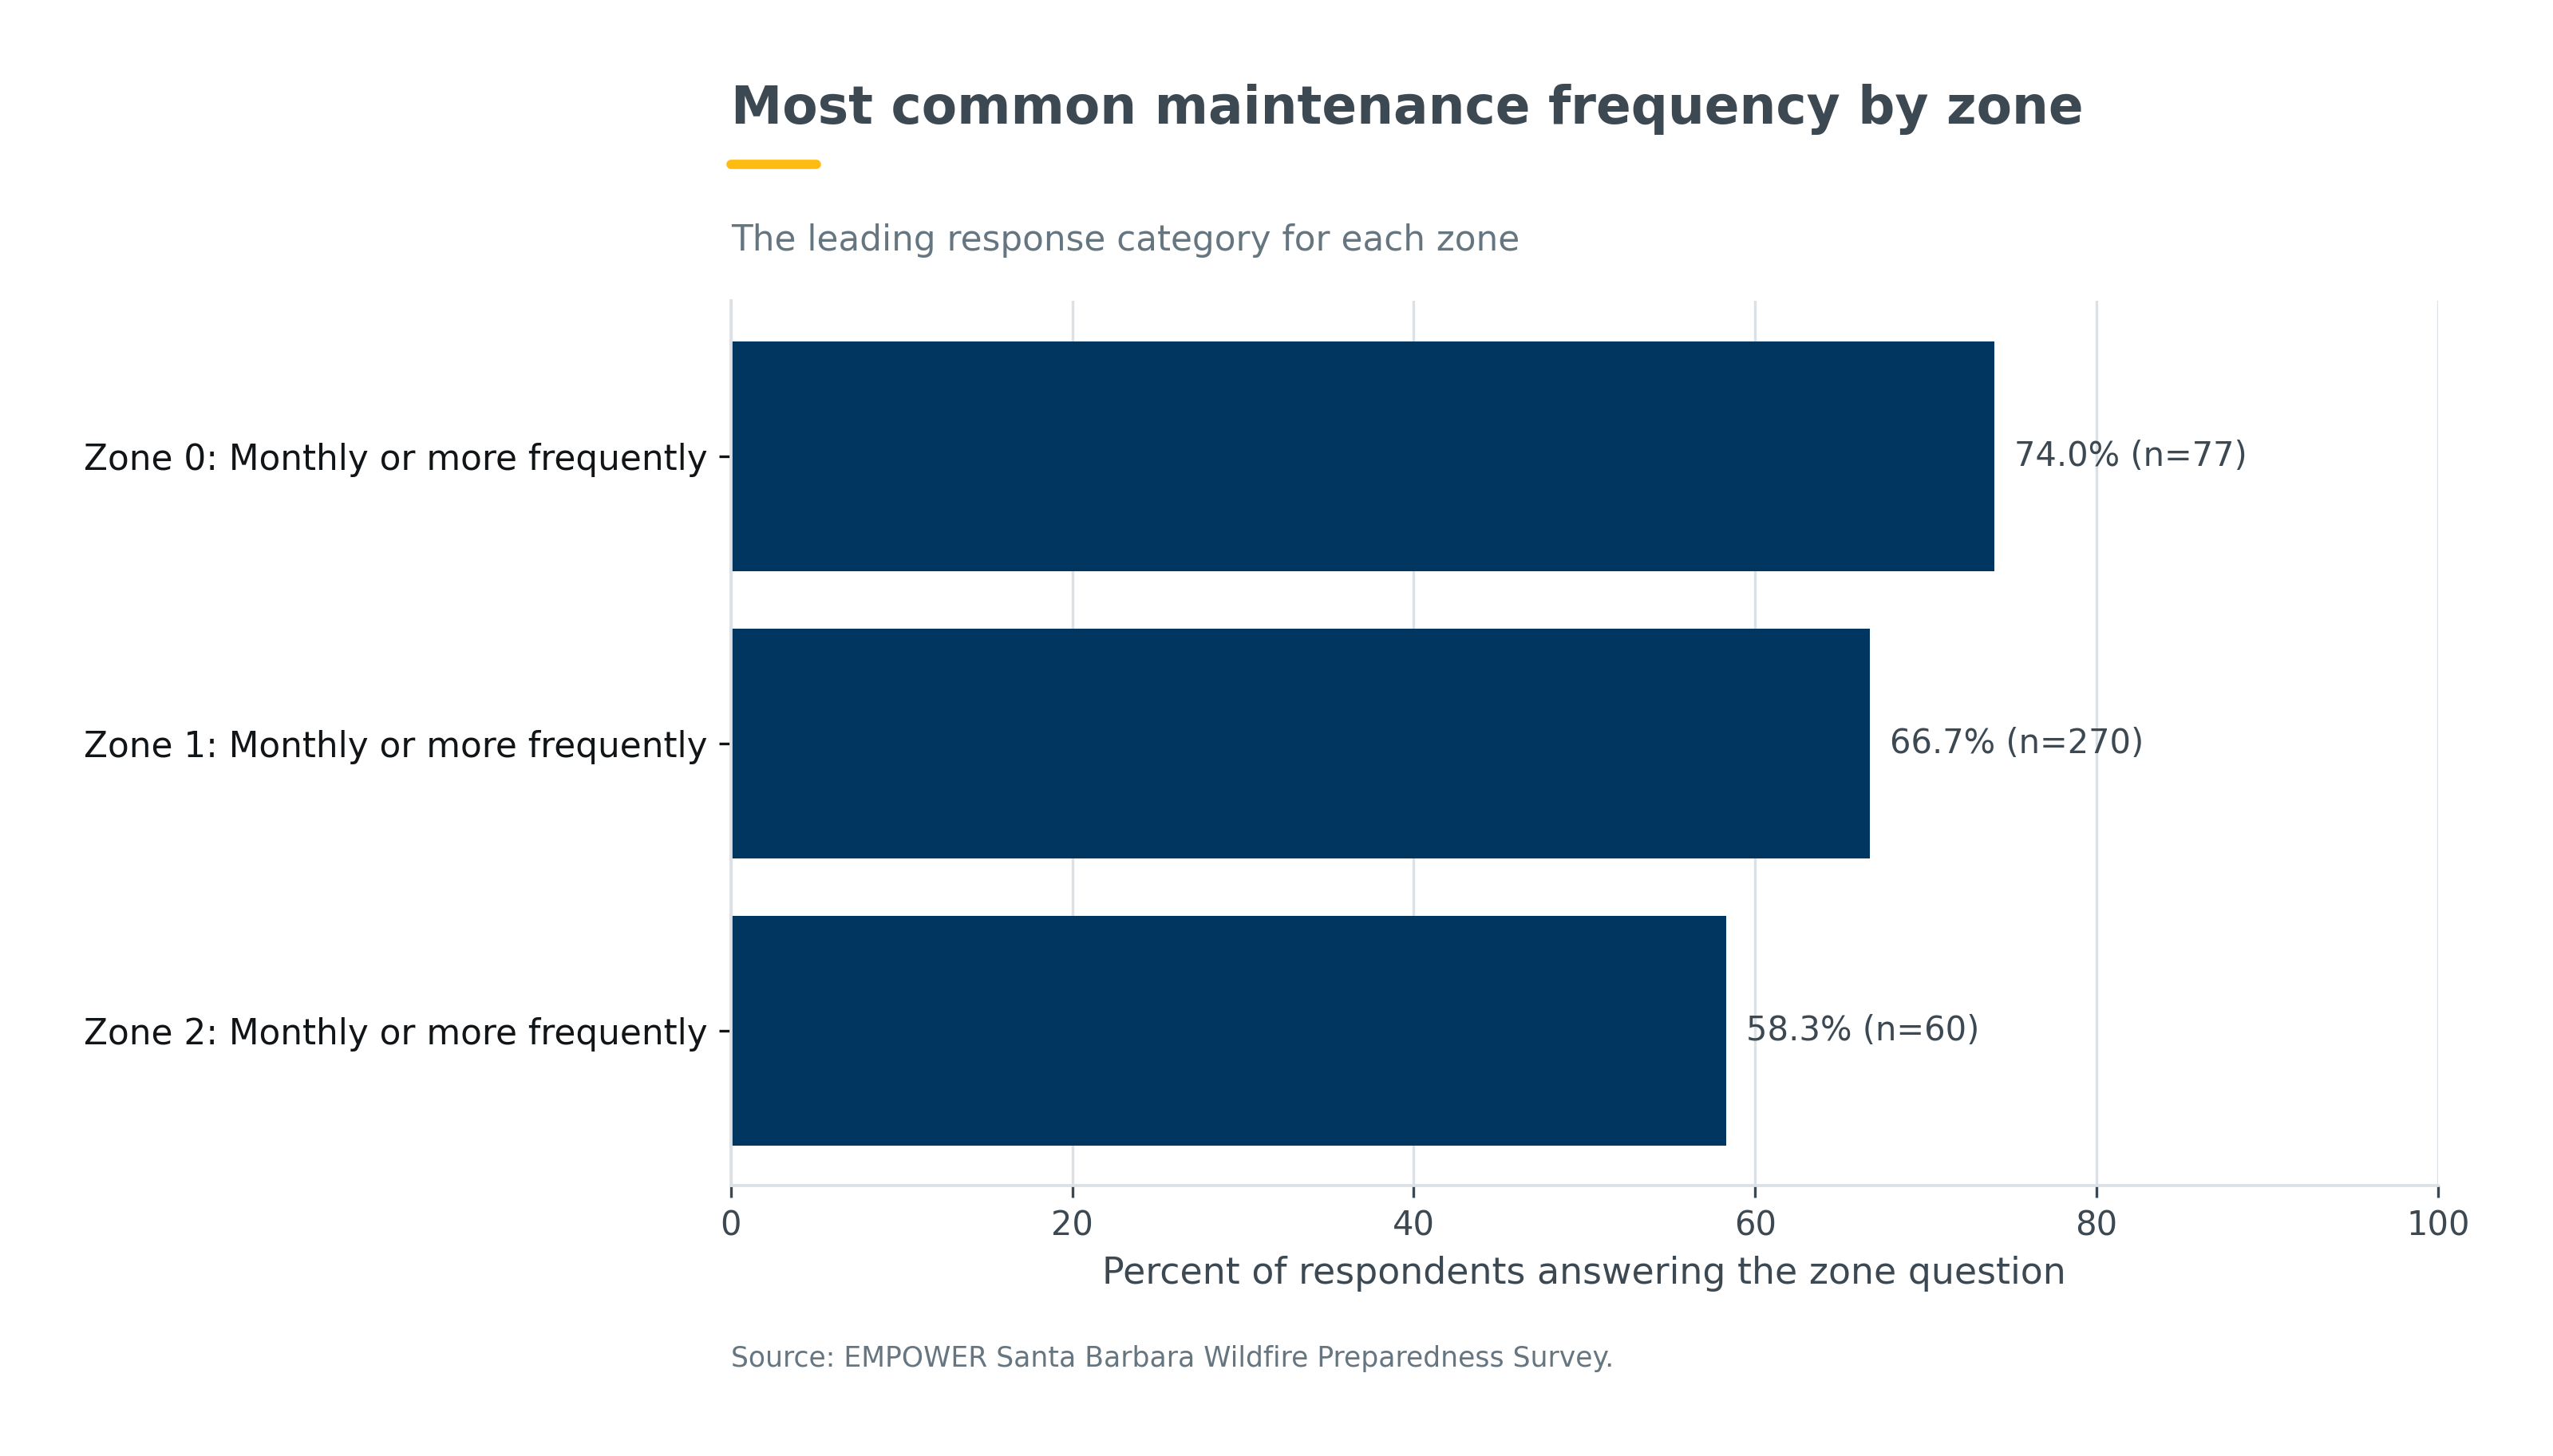
The most common maintenance schedule was Monthly or more frequently (74.0%, n=77 answering).

Zone 0 defensible-space illustration
Note. Zone 0 focuses on the first five feet around structures.

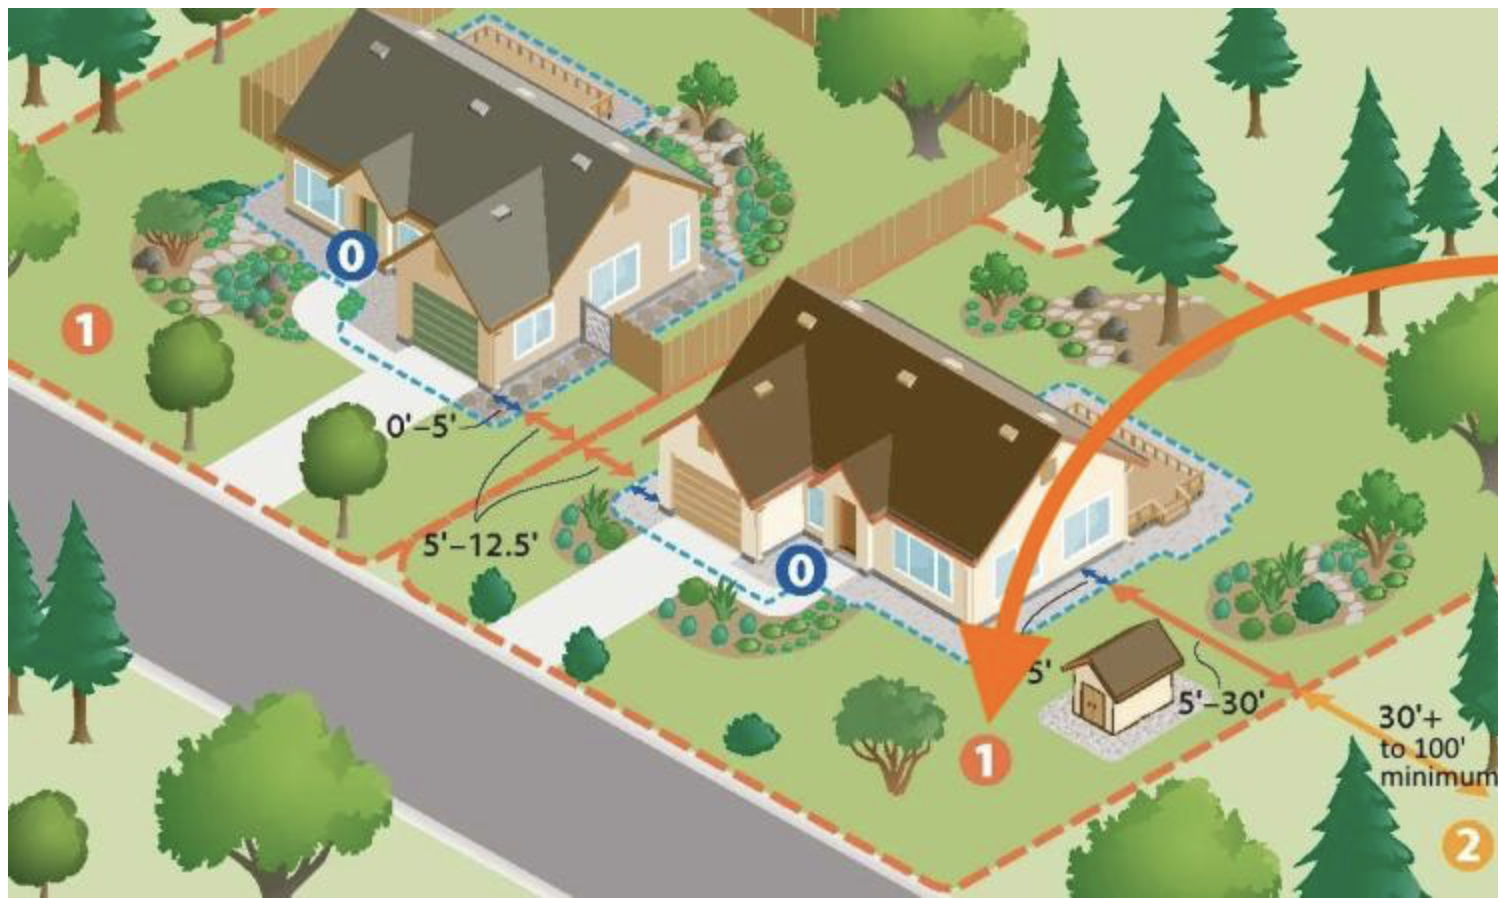
Zone 1 · 5–30 feet

Lean, maintained vegetation and separated fuels

Zone 1 activities include regular removal of dead plant material, cutting grasses and weeds to three inches or lower, watering plants, trimming low or overhanging limbs, maintaining horizontal and vertical spacing, relocating large combustible items, and maintaining clear space around propane tanks and outbuildings.

Large shrub branches removed76.8%n=271 answering
Plants watered regularly88.6%n=271 answering

The most common maintenance schedule was Monthly or more frequently (66.7%, n=270 answering).

Zone 1 defensible-space illustration
Note. Zone 1 extends from 5 to 30 feet from structures.
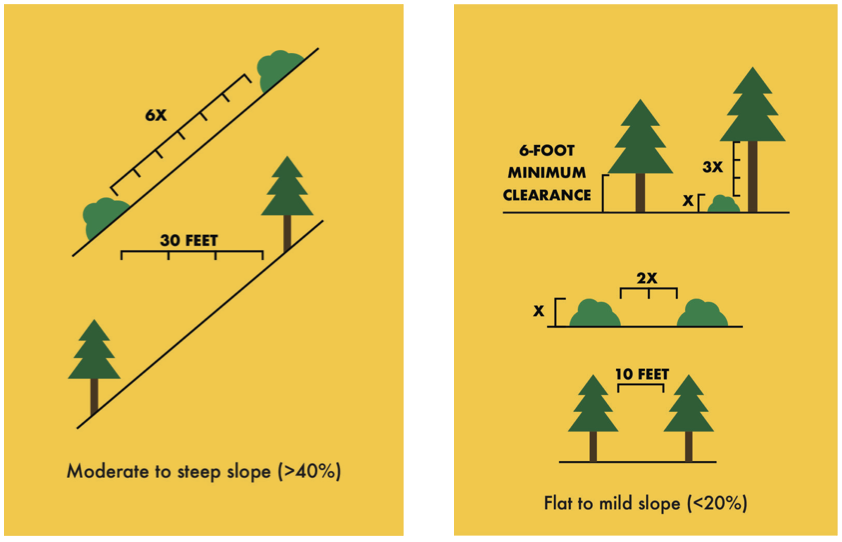
Vertical and horizontal vegetation spacing guidance
Note. Spacing guidance varies with slope and vegetation height.

Zone 2 · 30–100 feet

Reduced fuels and continued vegetation spacing

Zone 2 activities include trimming annual grasses to four inches or lower, maintaining horizontal and vertical spacing, removing deep accumulations of dead plant material, creating bare-soil buffers around wood piles, and maintaining clear areas around propane tanks and outbuildings.

Shrub clumps horizontally separated40.0%n=60 answering
Annual grasses below 4 inches88.3%n=60 answering

The most common maintenance schedule was Monthly or more frequently (58.3%, n=60 answering).

Zone 2 defensible-space illustration
Note. Zone 2 extends from 30 to at least 100 feet from structures.
Specific defensible-space actions completed
Note. Percent answering Yes to each action, by FireWise status.
Most common maintenance frequency by zone
Note. The leading response category for each zone.

What the defensible-space results mean

No single action is enough on its own. The three zones work together: Zone 0 limits combustible material next to the structure, Zone 1 interrupts the movement of flames through nearby vegetation, and Zone 2 reduces fuel continuity farther from the home. Regular maintenance is essential because vegetation and debris return over time.

Additional results

Perceived effectiveness of mitigation actions

Respondents rated how effective several wildfire mitigation strategies would be. The chart shows the share selecting the top two effectiveness categories.

Explore chart
Note. Values are displayed on a common 0–100 scale for easier comparison. Sample sizes: overall n=75-76; FireWise n=34-35; non-FireWise n=41. Percentages use valid responses to each item; denominators may vary. Source: EMPOWER Santa Barbara Wildfire Preparedness Survey.

Action-level results

ZoneActionOverall %AnsweredFireWise %Non-FireWise %
Zone 0Live plants removed within 5 feet
90.9%
77
88.9%
92.7%
Zone 0Non-combustible groundcover used
85.7%
77
80.6%
90.2%
Zone 1Large shrub branches removed
76.8%
271
80.4%
72.7%
Zone 1Plants watered regularly
88.6%
271
89.5%
87.5%
Zone 2Shrub clumps horizontally separated
40.0%
60
45.2%
34.5%
Zone 2Annual grasses trimmed below 4 inches
88.3%
60
96.8%
79.3%
Note. Sample sizes: overall n=24-271; FireWise n=14-143; non-FireWise n=10-128. Percentages use valid responses to each item; denominators may vary. Source: EMPOWER Santa Barbara Wildfire Preparedness Survey.

Maintenance-frequency results

ZoneFrequencyPercentCountAnswered
Zone 0Annually
3.9%
377
Zone 0Monthly or more frequently
74.0%
5777
Zone 0Seasonally
11.7%
977
Zone 0Not sure
5.2%
477
Zone 0Quarterly
5.2%
477
Zone 1Annually
5.2%
14270
Zone 1Never
1.5%
4270
Zone 1Monthly or more frequently
66.7%
180270
Zone 1Seasonally
14.4%
39270
Zone 1Quarterly
8.5%
23270
Zone 1Not sure
3.7%
10270
Zone 2Annually
1.7%
160
Zone 2Never
3.3%
260
Zone 2Monthly or more frequently
58.3%
3560
Zone 2Seasonally
21.7%
1360
Zone 2Quarterly
13.3%
860
Zone 2Not sure
1.7%
160
Note. Sample sizes: overall n=1-270; FireWise n=0-143; non-FireWise n=1-127. Percentages use valid responses to each item; denominators may vary. Source: EMPOWER Santa Barbara Wildfire Preparedness Survey.

What does this mean for Firewise Communities?

Defensible space is one of the most effective actions homeowners can take to reduce wildfire risk, but maintaining it requires ongoing effort. Firewise communities can use these results to encourage annual cleanup days, share defensible space resources, and celebrate residents who take action. When neighbors work together, the entire community becomes more resilient to wildfire.

Home hardening3 / 8

Reducing structural vulnerability

Home-hardening measures DefinitionMaintenance or building changes intended to reduce structural wildfire vulnerability. Why it mattersEmbers can ignite homes or enter through vulnerable building components. How it was measuredRespondents selected home-hardening or maintenance actions they reported completing.
Big takeaway

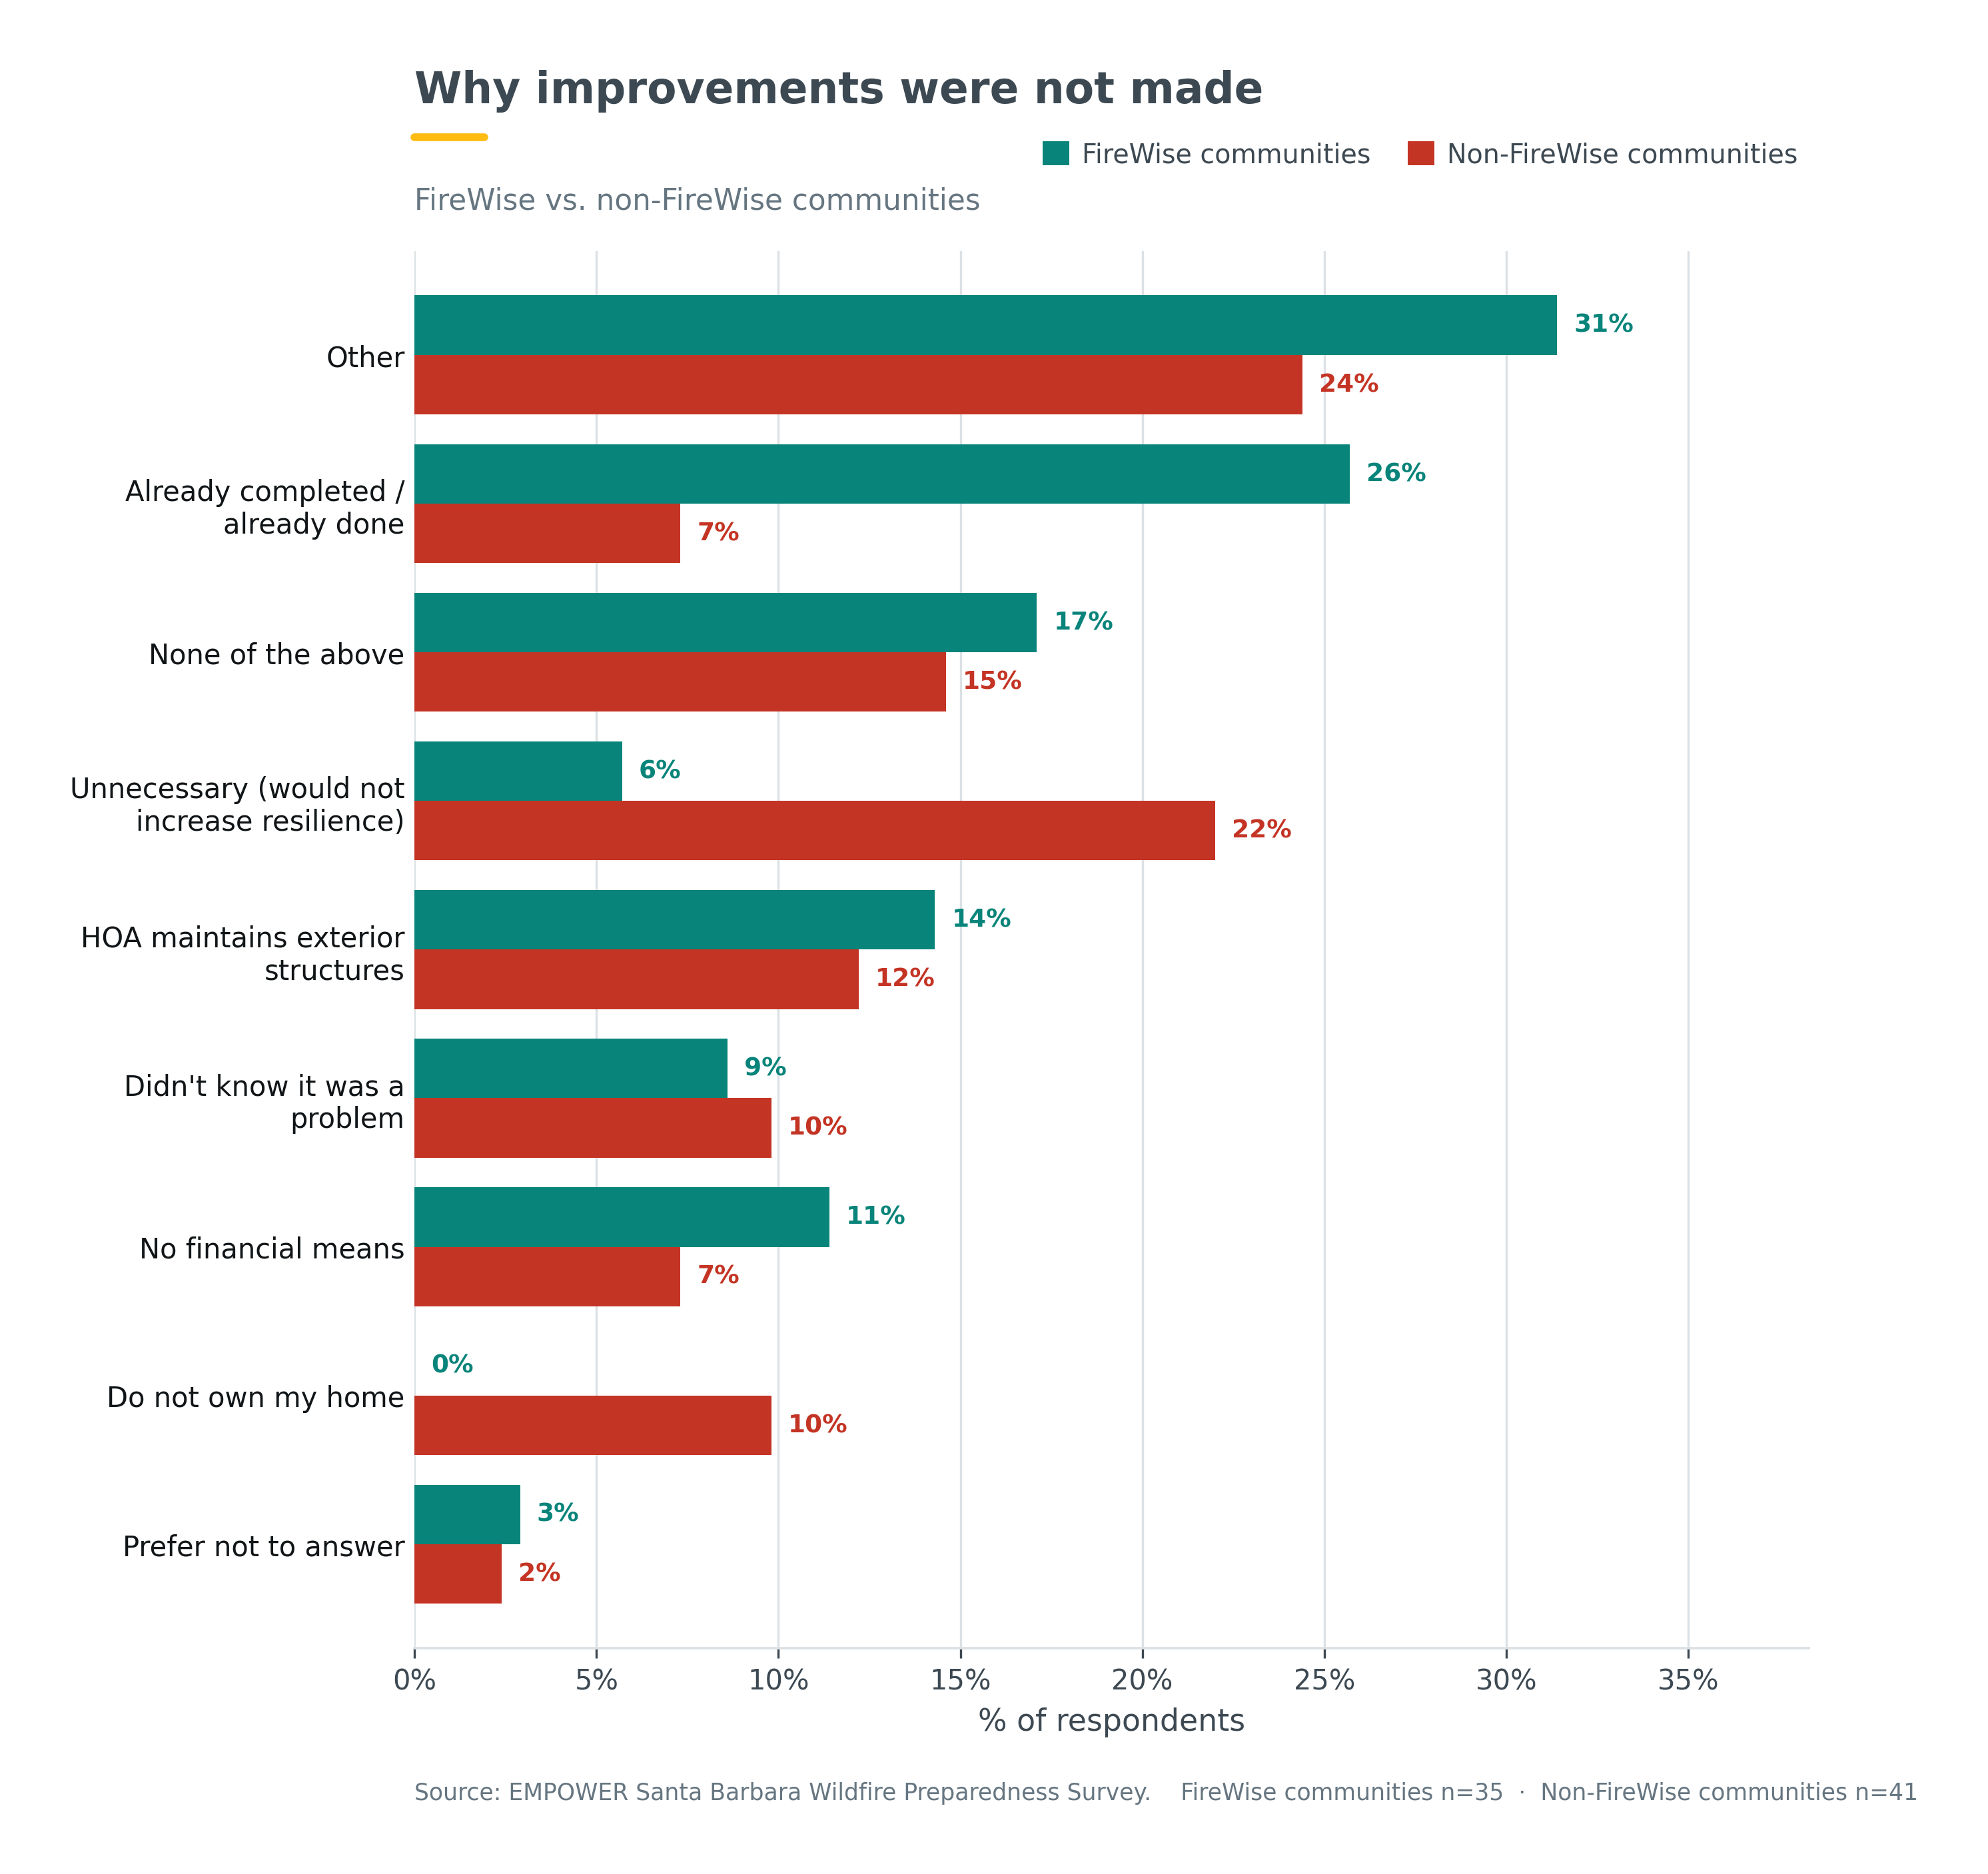
The three most frequently reported completed actions were Housekeeping (debris removal), Roof improvements, Signage / address numbers. Among those asked why improvements were not made, 9.2% cited financial means and 9.2% said they did not know it was a problem.

Debris removal and roof-related improvements were among the most frequently completed actions. Weather stripping around garage doors and window improvements were less common, showing that many homes may still have openings where wind-driven embers can enter.

  • Window improvements: 42.1% reported completing it.
  • Weather stripping (garage doors): 25.0% reported completing it.

Among respondents who explained why additional work had not been completed, financial constraints and limited awareness were recurring obstacles. 15.8% reported that the relevant work had already been completed. Because this answer applied to the home as a whole, it cannot be linked to one specific improvement.

Explore chart
Note. Hover to compare FireWise and non-FireWise percentages. Sample sizes: overall n=0-57; FireWise n=0-30; non-FireWise n=0-27. Percentages use valid responses to each item; denominators may vary. Source: EMPOWER Santa Barbara Wildfire Preparedness Survey.
Reasons improvements were not made
Note. Reasons include cost, awareness, ownership, and prior completion.

What the home-hardening results mean

The survey includes both routine or relatively lower-cost maintenance actions and more substantial building upgrades. Routine actions include removing accumulated debris and maintaining or sealing existing components. More substantial structural improvements include work on windows, vents, roofing, siding, and major garage-door components.

Routine maintenance actions were generally more common than several structural improvements. Weather stripping around garage doors and window improvements were among the less commonly reported actions. Assistance programs may therefore have the greatest reach when they combine clear, home-specific recommendations with financial or technical support for more resource-intensive improvements such as window replacement, ember-resistant vent upgrades, roofing, siding, and major garage-door improvements.

More detail, fewer responses

Baseline-adjusted hardening

MeasureOverall %FireWise %Non-FireWise %HigherSignificant
Made ≥1 upgrade (self)
90.8%
94.3%
87.8%
FireWiseNo
Already hardened prior to ownership
15.8%
25.7%
7.3%
FireWiseNo
Hardened , self OR pre-existing (baseline-adjusted)
90.8%
94.3%
87.8%
FireWiseNo
Note. Sample sizes: FireWise n=35; non-FireWise n=41. Percentages use valid responses to each item; denominators may vary. Source: EMPOWER Santa Barbara Wildfire Preparedness Survey.

Reasons improvements were not made

ReasonOverall %CountFireWise %Non-FireWise %
Other
27.6%
21
31.4%
24.4%
Already completed / already done
15.8%
12
25.7%
7.3%
None of the above
15.8%
12
17.1%
14.6%
Unnecessary (would not increase resilience)
14.5%
11
5.7%
22.0%
HOA maintains exterior structures
13.2%
10
14.3%
12.2%
Didn't know it was a problem
9.2%
7
8.6%
9.8%
No financial means
9.2%
7
11.4%
7.3%
Do not own my home
5.3%
4
0.0%
9.8%
Prefer not to answer
2.6%
2
2.9%
2.4%
Note. Sample sizes: overall n=2-21; FireWise n=0-11; non-FireWise n=1-10. Percentages use valid responses to each item; denominators may vary. Source: EMPOWER Santa Barbara Wildfire Preparedness Survey.

What does this mean for Firewise Communities?

Home hardening is most effective when residents understand that every improvement helps, and that wildfire resilience doesn't stop at the property line. A hardened home is better protected when neighboring homes are also prepared. Firewise communities can encourage homeowners to start with simple, affordable upgrades, such as installing ember-resistant vents, replacing combustible mulch near the home, or maintaining roofs and gutters, while connecting residents with trusted guidance, home evaluation programs, funding opportunities, and resources for larger retrofits. By supporting residents at every stage, Firewise communities can help build safer, more resilient neighborhoods together.

Preparedness and readiness4 / 8

Actions households and communities have taken

Preparedness activities DefinitionActions completed before wildfire to improve household or community readiness. Why it mattersPlanning, drills, training, document protection, and assessments support faster emergency action. How it was measuredRespondents selected preparedness activities they reported completing.
Big takeaway

FireWise respondents reported higher completion percentages for nearly every listed preparedness activity. The largest gaps involved chipper events, wildfire education, training groups, and Home Ignition Zone assessments.

Backing up important documents and making a household emergency plan were among the most common preparedness steps. More resource-intensive or organized activities, such as evacuation drills, formal training, and Home Ignition Zone assessments, were much less common.

FireWise respondents reported higher participation in most activities, especially chipper events, wildfire education, training groups, and property assessments. In the table, a checkmark simply identifies activities for which the FireWise percentage was higher.

Explore chart
Note. Hover for exact values; use the legend to compare one group at a time. Sample sizes: overall n=6-55; FireWise n=0-31; non-FireWise n=1-26. Percentages use valid responses to each item; denominators may vary. Source: EMPOWER Santa Barbara Wildfire Preparedness Survey.

What the preparedness results mean

Basic household planning is widespread, but practice-based activities remain uncommon. Expanding drills, assessments, and hands-on training may help residents turn awareness into actions they can use during an emergency.

Preparedness activities table
ActivityOverall %FireWise %Non-FireWise %FireWise higher
Back-up important documents
72.4%
88.6%
58.5%
Higher
Household emergency planning
71.1%
80.0%
63.4%
Higher
Defensible space maintenance
59.2%
80.0%
41.5%
Higher
Emergency Go Bag & supplies
53.9%
60.0%
48.8%
Higher
Spring 2024 chipper events
36.8%
62.9%
14.6%
Higher
Spring 2025 chipper events
35.5%
57.1%
17.1%
Higher
Structural hardening / retrofit
35.5%
42.9%
29.3%
Higher
Home Ignition Zone assessment
34.2%
54.3%
17.1%
Higher
Emergency prep/training group (CERT etc.)
30.3%
51.4%
12.2%
Higher
2024 wildfire education activities
30.3%
54.3%
9.8%
Higher
Practiced community evacuation drill
10.5%
20.0%
2.4%
Higher
Practiced household evacuation drill
9.2%
14.3%
4.9%
Higher
None of the above
7.9%
0.0%
14.6%
,
Note. Sample sizes: overall n=6-55; FireWise n=0-31; non-FireWise n=1-26. Percentages use valid responses to each item; denominators may vary. Source: EMPOWER Santa Barbara Wildfire Preparedness Survey.
More detail, fewer responses

Activity-field summary

ActivityOverall %FireWise %Non-FireWise %HigherSignificant
Back-up important documents
16.0%
19.2%
13.1%
FireWiseNo
Household emergency planning
15.4%
16.6%
14.3%
FireWiseNo
Defensible-space maintenance
13.5%
17.2%
10.1%
FireWiseNo
Emergency Go Bag & supplies
12.2%
13.2%
11.3%
FireWiseNo
Home Ignition Zone assessment
7.2%
11.3%
3.6%
FireWiseYes
Structural hardening upgrades
7.2%
8.6%
6.0%
FireWiseNo
Emergency prep/training group
6.3%
9.9%
3.0%
FireWiseYes
Note. Sample sizes: overall n=20-51; FireWise n=13-29; non-FireWise n=5-24. Percentages use valid responses to each item; denominators may vary. Source: EMPOWER Santa Barbara Wildfire Preparedness Survey.

What does this mean for Firewise Communities?

Firewise respondents consistently reported higher participation in preparedness activities than non-Firewise respondents, particularly in chipper events, wildfire education, community training, and Home Ignition Zone (HIZ) assessments. These findings highlight the value of sustained community engagement and suggest that Firewise leaders can strengthen neighborhood resilience by continuing to promote these programs and encouraging participation from all residents.

Risk perception5 / 8

Experience, expectations, and neighborhood risk

Risk measures DefinitionReported wildfire experience and perceptions of future wildfire risk. Why it mattersRisk perception can influence motivation to prepare and communication needs. How it was measuredSurvey questions about prior wildfire experience and perceived likelihood or impact.
Big takeaway

57.7% reported having evacuated from home at least once. Perceived lifetime wildfire impact averaged 4.03 on the five-point likelihood scale.

Wildfire was not an abstract concern for many respondents: more than half had evacuated their home at least once, and substantial shares had seen an active fireline or experienced property loss nearby.

Respondents generally viewed wildfire as more likely to affect their home over their lifetime than during the next year. Most also viewed neighbors as valuable prevention partners, although nearby properties can increase shared risk when vegetation and structures are not maintained.

Explore chart
Note. Hover for exact percentages and compare groups using the legend. Sample sizes: overall n=6-192; FireWise n=2-111; non-FireWise n=4-87. Percentages use valid responses to each item; denominators may vary. Source: EMPOWER Santa Barbara Wildfire Preparedness Survey.
Explore chart
Note. Hover over each point for the exact average. Sample sizes: overall n=76; FireWise n=35; non-FireWise n=41. Averages are based on valid responses to each likelihood item. Source: EMPOWER Santa Barbara Wildfire Preparedness Survey.

What the risk results mean

Past wildfire experience appears to coexist with high long-term concern. Communication should therefore reinforce practical next steps,not only the seriousness of wildfire risk,while recognizing that residents depend on one another for neighborhood-level safety.

Perception of Neighbors as Prevention Partners
PerceptionOverall %FireWise %Non-FireWise %
Good Partners
84.2%
88.6%
80.5%
Worrying Partners
52.6%
51.4%
53.7%
Note. Sample sizes: overall n=40-76; FireWise n=18-35; non-FireWise n=22-41. Percentages use valid responses to each item; denominators may vary. Source: EMPOWER Santa Barbara Wildfire Preparedness Survey.
More detail, fewer responses

Information used during the most recent fire

Information source%Count
Subscribed alert service / app
54.2%
13
Wireless Emergency Alerts
37.5%
9
Internet / news website
37.5%
9
Other
33.3%
8
Reverse 911 call
29.2%
7
Television announcement
25.0%
6
Someone told you (neighbor/friend/family)
25.0%
6
First responder (door-to-door)
16.7%
4
Social media
8.3%
2
Sirens
8.3%
2
Radio announcement
4.2%
1
Billboard / road message board
4.2%
1
I don't know
4.2%
1
Note. Sample sizes: overall n=1-13; FireWise n=0-6; non-FireWise n=0-7. Percentages use valid responses to each item; denominators may vary. Source: EMPOWER Santa Barbara Wildfire Preparedness Survey.

Barriers to wildfire mitigation

Barrier%Count
Cost
62.5%
15
Other
37.5%
9
Aesthetics
29.2%
7
Lack of community support
25.0%
6
Lack of public support
25.0%
6
Not enough time
20.8%
5
Access to gardening/landscaping help
20.8%
5
Lack of community engagement
16.7%
4
Lack of education on strategies
16.7%
4
Low perception of risk
12.5%
3
Lack of communication
8.3%
2
No one else does it
8.3%
2
Don't own my home
8.3%
2
No opportunity to engage
4.2%
1
Note. Sample sizes: overall n=1-15; FireWise n=0-10; non-FireWise n=1-5. Percentages use valid responses to each item; denominators may vary. Source: EMPOWER Santa Barbara Wildfire Preparedness Survey.

What does this mean for Firewise Communities?

Many residents already recognize wildfire as a significant and personal risk, with more than half reporting that they have evacuated due to wildfire. Firewise communities can build on this awareness by helping neighbors move from concern to action through education, preparedness activities, and community-based mitigation efforts. Turning awareness into action is a key step toward building long-term wildfire resilience.

Community connections6 / 8

Wildfire readiness is also social

Community preparedness measures DefinitionNeighborhood communication, social connection, and mutual assistance related to wildfire. Why it mattersNeighbors share evacuation routes, vegetation conditions, information, and assistance needs. How it was measuredSurvey questions about communication channels, events, conversations, and neighbor assistance.
Big takeaway

FireWise respondents were more likely to report neighborhood communication channels, social events, wildfire-preparedness groups, preparedness conversations, and helping or advising neighbors.

Everyday neighbor support was common, and many respondents reported communication through newsletters, social media, or neighborhood events. These existing relationships provide a foundation for sharing alerts, coordinating vegetation work, and checking on residents who may need assistance.

FireWise respondents were especially likely to report local preparedness groups, wildfire conversations with neighbors, and direct help or advice related to defensible space. The pattern suggests that organized community networks can make preparedness more visible and easier to act on.

Explore chart
Note. Hover to see exact group percentages. Sample sizes: overall n=2-76; FireWise n=2-35; non-FireWise n=0-41. Percentages use valid responses to each item; denominators may vary. Source: EMPOWER Santa Barbara Wildfire Preparedness Survey.
Explore chart
Note. Select a legend item to focus on one community group. Sample sizes: overall n=1-48; FireWise n=0-29; non-FireWise n=1-20. Percentages use valid responses to each item; denominators may vary. Source: EMPOWER Santa Barbara Wildfire Preparedness Survey.

What the community results mean

Preparedness is easier when residents already know how to reach one another and have trusted local organizations. Community events and routine neighbor support can be used to connect residents with defensible-space assistance, alerts, and evacuation planning.

Community infrastructure indicators
IndicatorOverall %FireWise %Non-FireWise %
Neighborhood newsletter / social media
52.6%
77.1%
31.7%
Communications contain preparation content
87.5%
96.3%
69.2%
Neighborhood holds social events
73.7%
94.3%
56.1%
Local wildfire-prep discussion group
49.3%
91.4%
12.5%
Trust most people in neighborhood
89.5%
94.3%
85.4%
Neighborhood has a Beacon Box
2.7%
5.9%
0.0%
Note. Sample sizes: overall n=2-76; FireWise n=2-35; non-FireWise n=0-41. Percentages use valid responses to each item; denominators may vary. Source: EMPOWER Santa Barbara Wildfire Preparedness Survey.
Additional community results

Actions performed for neighbors

ActionOverall %FireWise %Non-FireWise %HigherSignificant
Everyday help (groceries, mail, trash bins)
86.2%
89.7%
83.3%
FireWiseNo
Care (childcare, pet care, plant care)
73.8%
75.9%
72.2%
FireWiseNo
Note. Sample sizes: overall n=48-56; FireWise n=22-26; non-FireWise n=26-30. Percentages use valid responses to each item; denominators may vary. Source: EMPOWER Santa Barbara Wildfire Preparedness Survey.

Help creating or maintaining defensible space

IndicatorOverall %FireWise %Non-FireWise %
Physically helped a neighbor (defensible space)
16.2%
26.5%
7.5%
Helped OR advised a neighbor
40.5%
67.6%
17.5%
Note. Sample sizes: overall n=12-74; FireWise n=9-34; non-FireWise n=3-40. Percentages use valid responses to each item; denominators may vary. Source: EMPOWER Santa Barbara Wildfire Preparedness Survey.

Who respondents discussed preparedness with

Person or groupOverall %FireWise %Non-FireWise %
Friends / family / household
64.9%
82.4%
50.0%
Neighbors
54.1%
85.3%
27.5%
Local representatives (fire dept, leaders)
36.5%
52.9%
22.5%
SB County Fire Safe Council
27.0%
44.1%
12.5%
None of the above
16.2%
2.9%
27.5%
Other
6.8%
8.8%
5.0%
Prefer not to answer
1.4%
0.0%
2.5%
Note. Sample sizes: overall n=1-48; FireWise n=0-29; non-FireWise n=1-20. Percentages use valid responses to each item; denominators may vary. Source: EMPOWER Santa Barbara Wildfire Preparedness Survey.

What does this mean for Firewise Communities?

Communities with stronger social engagement reported higher preparedness scores. Firewise leaders may wish to prioritize neighborhood events and communication alongside vegetation management.

Wildfire readiness7 / 8

Take action before wildfire arrives

Start here

Sign up for Santa Barbara County emergency alerts, make a household evacuation plan, and reduce combustible material around the home. These steps work together: alerts provide time, planning supports a safer departure, and property preparation can reduce fire intensity near structures.

Receive evacuation and safety information

Santa Barbara County emergency alerts provide time-sensitive information about wildfire, evacuation warnings and orders, severe weather, and other emergencies. Every adult household member should be enrolled and should keep contact information current.

Sign up for SBC Alerts

Take the EMPOWER Santa Barbara survey

Share your household and neighborhood wildfire-preparedness experiences to help inform local research, outreach, and community programs.

Take the survey
01

Know how you will leave

Identify more than one route, decide where household members will meet, plan for anyone who may need assistance, and include pets or large animals. Keep vehicles fueled or charged and avoid waiting for the final moments to prepare.

  • Choose an out-of-area contact.
  • Practice loading people, animals, medications, and essential equipment.
  • Know the difference between an evacuation warning and an evacuation order.
02

Prepare what you will take

Keep a go bag where it can be reached quickly. Customize supplies for medications, mobility needs, children, animals, work equipment, and the length of time you may be away.

  • Water, food, flashlight, radio, chargers, and protective clothing.
  • Medication list, prescriptions, identification, and insurance records.
  • Digital backups of important documents and photographs.
03

Reduce fuels around the home

Begin at the structure and work outward. Remove leaves and needles from roofs and gutters, keep the first five feet as noncombustible as possible, maintain healthy and separated vegetation, and address ladder fuels that can carry fire into tree canopies.

  • Review Zones 0, 1, and 2 on the Defensible Space page.
  • Repeat maintenance throughout the year, not only once.
  • Coordinate with neighbors where vegetation and access are shared.
04

Harden vulnerable building components

Embers can enter through small openings or ignite combustible materials against the home. Prioritize roofs, vents, eaves, windows, siding, decks, fences, garage doors, and gaps where wind-driven embers can collect.

  • Use ember-resistant vents and maintain screens.
  • Seal garage-door gaps and inspect weather stripping.
  • Move combustible furniture and stored material away during high-risk periods.

Five actions to complete now

  1. Enroll every adult in SBC Alerts.
  2. Choose two evacuation routes and a meeting location.
  3. Assemble or update household go bags.
  4. Clear roofs, gutters, decks, and the first five feet around the home.
  5. Talk with at least one neighbor about alerts, assistance needs, and evacuation plans.

What does this mean for Firewise Communities?

Wildfire resilience is built through consistent action at both the household and neighborhood level. Firewise communities can help residents prepare by promoting emergency alerts, evacuation planning, home assessments, and ongoing mitigation efforts. When more neighbors take these steps together, the entire community is better prepared to respond to and recover from wildfire.

Board detail8 / 8

Board access

Enter the board password to open the interactive analysis portal.

Board data portal

Central finding

Self-reported alignment with defensible-space guidance is high, but reported retrofit completion and specific defensible-space actions do not fully align with those perceptions. The gap suggests that awareness and confidence are not always translating into completed property-level mitigation.

Zone 0 average self-reported alignment with zone guidance 66.0%
FireWise67.2%n=36
Non-FireWise64.9%n=41
Zone 1 average self-reported alignment with zone guidance 70.0%
FireWise74.0%n=143
Non-FireWise65.5%n=127
Zone 2 average self-reported alignment with zone guidance 66.0%
FireWise72.9%n=31
Non-FireWise58.6%n=29
Home hardening37.8%Average reported retrofit or hardening measure

Respondents generally rated wildfire mitigation, defensible space, and related protective strategies as effective. Where broad self-reported zone-alignment measures were available, reported alignment also tended to be favorable. In contrast, item-level results show that many specific vegetation-management actions and structural retrofits were completed by a smaller share of households.

This difference is important for program planning. Self-assessments can indicate confidence and awareness, while the action questions identify work that has actually been completed. Both should be considered, but they should not be treated as interchangeable measures of readiness.

Self-reported alignment compared with completed mitigation

Each point represents a zone-level average. The correlation summaries measure the respondent-level association between reported alignment with zone guidance and completion of the specific mitigation actions measured for the same zone.

Explore and compare survey measures

Select two measures for side-by-side plots. Each panel reports the group-specific sample, effect estimate, and an appropriate FireWise versus non-FireWise statistical test.

How to interpret the tests

Tests are selected from a prespecified, board-only hypothesis configuration. Ordered measures with a directional hypothesis use a one-sided Mann-Whitney U test with the alternative FireWise > non-FireWise. Binary measures with a directional hypothesis use a one-sided Fisher exact test of whether the positive response is more common among FireWise respondents. Ordered and binary measures without a directional hypothesis remain two-sided. Unordered multi-category measures use a two-sided omnibus chi-square test of the full response table..

Model outcomes by FireWise community age

Select an outcome to estimate its association with the number of years a FireWise community has been established. Outcomes are grouped by dashboard theme and mirror measures shown throughout the public report and the board's Explore and compare survey measures section. Community age is calculated from Date_Award to the dashboard generation date. Only dependent variables with more than 30 valid mapped FireWise respondents are included.

How to interpret this model

The coefficient is reported for one additional year that a FireWise community has been established. A positive coefficient means the selected outcome tends to be higher in longer-established communities. A negative coefficient means the selected outcome tends to be higher in newer communities. Statistical significance is evaluated at p < 0.05. The model is descriptive and should not be interpreted as causal.

Evacuation vulnerability and implementation barriers

Interactive
Evacuation orders, vehicle capacity, and related indicators.
Interactive
Leading barriers to home-hardening and mitigation actions.
Evacuation-related results
Question fieldResponseCount% / meanAnswered
enough_vehicles_to_evacuate_all_hhYes41
100.0%
41
evacuated_during_most_recent_fireYes7
50.0%
14
evacuated_during_most_recent_fireNo7
50.0%
14
knowledge_how_to_signup_emergency_alertsA lot145
52.7%
275
knowledge_how_to_signup_emergency_alertsQuite a bit72
26.2%
275
knowledge_how_to_signup_emergency_alertsSome30
10.9%
275
knowledge_how_to_signup_emergency_alertsA little16
5.8%
275
knowledge_how_to_signup_emergency_alertsNothing11
4.0%
275
knowledge_how_to_signup_emergency_alertsPrefer not to answer1
0.4%
275
most_recent_fire_received_mandatory_evacuation_orderYes110
54.7%
201
most_recent_fire_received_mandatory_evacuation_orderNo91
45.3%
201
most_recent_fire_received_voluntary_evacuation_orderYes151
75.1%
201
most_recent_fire_received_voluntary_evacuation_orderNo50
24.9%
201
num_animals_by_typeDogs or Cats (please enter the number below),Small pets (birds, rabbits, reptiles, etc),Large animals (horses, farm animals, etc)21
65.6%
32
num_animals_by_typeDogs or Cats (please enter the number below)8
25.0%
32
num_animals_by_typeDogs or Cats (please enter the number below),Small pets (birds, rabbits, reptiles, etc)2
6.2%
32
num_animals_by_typeDogs or Cats (please enter the number below),Large animals (horses, farm animals, etc)1
3.1%
32
num_hh_members_unable_to_self_evacuate0.036
87.8%
41
num_hh_members_unable_to_self_evacuate1.02
4.9%
41
num_hh_members_unable_to_self_evacuate2.02
4.9%
41
num_hh_members_unable_to_self_evacuate3.01
2.4%
41
num_largeanimals0.020
90.9%
22
num_largeanimals1.02
9.1%
22
num_smallpets0.020
87.0%
23
num_smallpets1.01
4.3%
23
num_smallpets3.01
4.3%
23
num_smallpets4.01
4.3%
23
num_times_evacuated_from_current_home249
25.9%
189
num_times_evacuated_from_current_home138
20.1%
189
num_times_evacuated_from_current_home036
19.0%
189
num_times_evacuated_from_current_home323
12.2%
189
num_times_evacuated_from_current_home422
11.6%
189
num_times_evacuated_from_current_home513
6.9%
189
num_times_evacuated_from_current_home63
1.6%
189
num_times_evacuated_from_current_home82
1.1%
189
num_times_evacuatedfrommyhomeMean (numeric)184
13.7%
191
perceived_effectiveness_emergency_alertsVery effective29
38.2%
76
perceived_effectiveness_emergency_alertsExtremely effective24
31.6%
76
perceived_effectiveness_emergency_alertsModerately effective19
25.0%
76
perceived_effectiveness_emergency_alertsSlightly effective3
3.9%
76
perceived_effectiveness_emergency_alertsNot effective at all1
1.3%
76
perceived_effectiveness_evacuation_planningExtremely effective30
39.5%
76
perceived_effectiveness_evacuation_planningVery effective27
35.5%
76
perceived_effectiveness_evacuation_planningModerately effective15
19.7%
76
perceived_effectiveness_evacuation_planningSlightly effective3
3.9%
76
perceived_effectiveness_evacuation_planningNot effective at all1
1.3%
76
Note. Percentages use valid responses to each item; denominators may vary. Source: EMPOWER Santa Barbara Wildfire Preparedness Survey.
Full statistical comparison ledger
figurecategoryfw_valuenonfw_valuediff_fw_minus_nonfwp_valuesignificant
preparedness_completed_multiselect.pngSpring 2024 chipper events62.914.648.30.0Higher
risk_experience_aggregate.pngEvacuated from home73.543.530.00.0Higher
risk_concern_means.pngProperty damage78.051.526.50.0Higher
community_infrastructure.pngLocal wildfire-prep discussion group91.412.578.90.0Higher
community_discussed_with.pngNeighbors85.327.557.80.0Higher
community_helped_neighbor.pngHelped OR advised a neighbor67.617.550.10.0Higher
preparedness_completed_multiselect.png2024 wildfire education activities54.39.844.50.0001Higher
community_infrastructure.pngNeighborhood newsletter / social media77.131.745.40.0002Higher
preparedness_completed_multiselect.pngEmergency prep/training group (CERT etc.)51.412.239.20.0005Higher
community_infrastructure.pngNeighborhood holds social events94.356.138.20.0005Higher
preparedness_completed_multiselect.pngSpring 2025 chipper events57.117.140.00.0007Higher
risk_likelihood.pngImpact home in lifetime91.456.135.30.0007Higher
preparedness_completed_multiselect.pngDefensible space maintenance80.041.538.50.0015Higher
preparedness_completed_multiselect.pngHome Ignition Zone assessment54.317.137.20.0015Higher
risk_experience_aggregate.pngSeen an active fireline69.551.817.70.0018Higher
risk_concern_means.pngEconomic loss46.829.916.90.0048Higher
community_discussed_with.pngSB County Fire Safe Council44.112.531.60.0053Higher
preparedness_completed_multiselect.pngBack-up important documents88.658.530.10.0078Higher
community_discussed_with.pngFriends / family / household82.450.032.40.0078Higher
risk_concern_means.pngPhysical injury31.921.610.30.0104Higher
community_discussed_with.pngNone of the above2.927.5-24.60.0111Higher
risk_experience_aggregate.pngProperty destroyed (own)23.812.511.30.0126Higher
community_discussed_with.pngLocal representatives (fire dept, leaders)52.922.530.40.0136Higher
preparedness_activities.pngHome Ignition Zone assessment11.33.67.70.015Higher
preparedness_activities.pngEmergency prep/training group9.93.06.90.0199Higher
preparedness_completed_multiselect.pngPracticed community evacuation drill20.02.417.60.0209Higher
defensible_perceived_effectiveness.pngEvacuation planning85.765.919.80.0226Higher
risk_info_sources.pngReverse 911 call54.57.746.80.0233Higher
defensible_perceived_effectiveness.pngCommunity coordination82.963.419.50.0243Higher
preparedness_completed_multiselect.pngNone of the above0.014.6-14.60.028Higher
community_infrastructure.pngCommunications contain preparation content96.369.227.10.0313Higher
risk_barriers_to_mitigation.pngOther57.110.047.10.0333Higher
risk_experience_aggregate.pngProperty destroyed (neighborhood)29.819.010.80.0349Higher
risk_likelihood.pngImpact home in next year42.924.418.50.0395Higher
overview_kpis.pngUses gardener/landscaper80.656.124.50.0411Higher
defensible_zone_actions.pngZone 2: Annual grasses trimmed below 4 inches96.879.317.50.049Higher
community_helped_neighbor.pngPhysically helped a neighbor (defensible space)26.57.519.00.0588,
hardening_baseline_adjusted.pngAlready hardened prior to ownership25.77.318.40.0606,
hardening_reasons_not_made.pngAlready completed / already done25.77.318.40.0606,
hardening_upgrades_made.pngHousekeeping (debris removal)85.765.919.80.0841,
preparedness_activities.pngDefensible-space maintenance17.210.17.10.0911,
hardening_reasons_not_made.pngUnnecessary (would not increase resilience)5.722.0-16.30.0933,
defensible_perceived_effectiveness.pngVegetation management85.787.8-2.10.1026,
hardening_awareness.pngAware of pre-fire-season deadline88.670.717.90.1054,
defensible_perceived_effectiveness.pngCreating defensible space80.068.311.70.1146,
overview_kpis.pngRenters0.010.0-10.00.1197,
hardening_reasons_not_made.pngDo not own my home0.09.8-9.80.1197,
risk_barriers_to_mitigation.pngNot enough time7.140.0-32.90.1222,
hardening_upgrades_made.pngWeather stripping (garage doors)34.317.117.20.1439,
risk_barriers_to_mitigation.pngNo one else does it0.020.0-20.00.163,
risk_barriers_to_mitigation.pngDon't own my home0.020.0-20.00.163,
defensible_zone_actions.pngZone 1: Large shrub branches removed80.472.77.70.1718,
defensible_perceived_effectiveness.pngEmergency alerts77.163.413.70.1743,
preparedness_completed_multiselect.pngHousehold emergency planning80.063.416.60.1818,
preparedness_activities.pngBack-up important documents19.213.16.10.1823,
risk_info_sources.pngWireless Emergency Alerts54.523.131.40.206,
community_infrastructure.pngNeighborhood has a Beacon Box5.90.05.90.2077,
defensible_perceived_effectiveness.pngHardening the home55.943.912.00.2173,
preparedness_completed_multiselect.pngPracticed household evacuation drill14.34.99.40.2375,
community_infrastructure.pngTrust most people in neighborhood94.385.48.90.2751,
preparedness_completed_multiselect.pngStructural hardening / retrofit42.929.313.60.3205,
hardening_upgrades_made.pngDeck improvements25.714.611.10.3573,
defensible_zone_actions.pngZone 0: Non-combustible groundcover used80.690.2-9.60.3757,
risk_barriers_to_mitigation.pngCost71.450.021.40.4028,
risk_barriers_to_mitigation.pngNo opportunity to engage0.010.0-10.00.4167,
defensible_vegetation_activities.pngClear vegetation overhead & beside roads52.435.017.40.4201,
hardening_baseline_adjusted.pngMade ≥1 upgrade (self)94.387.86.50.4415,
hardening_baseline_adjusted.pngHardened , self OR pre-existing (baseline-adjusted)94.387.86.50.4415,
defensible_vegetation_activities.pngClear understory near trees/large shrubs66.750.016.70.4439,
preparedness_completed_multiselect.pngEmergency Go Bag & supplies60.048.811.20.4549,
risk_info_sources.pngI don't know9.10.09.10.4583,
risk_info_sources.pngSocial media0.015.4-15.40.4819,
preparedness_activities.pngStructural hardening upgrades8.66.02.60.4844,
hardening_upgrades_made.pngExterior wall / siding34.324.49.90.4874,
defensible_vegetation_activities.pngHOA maintains exterior structures0.05.0-5.00.4878,
defensible_vegetation_activities.pngNone of the above0.05.0-5.00.4878,
risk_neighbor_perceptions.pngGood Partners88.680.58.10.5172,
defensible_zone_actions.pngZone 2: Shrub clumps horizontally separated45.234.510.70.5619,
risk_info_sources.pngFirst responder (door-to-door)9.123.1-14.00.5963,
risk_barriers_to_mitigation.pngLack of community engagement21.410.011.40.6146,
hardening_awareness.pngTrees trimmed in last 5 yrs97.192.54.60.6197,
risk_info_sources.pngTelevision announcement18.230.8-12.60.6494,
risk_info_sources.pngSomeone told you (neighbor/friend/family)18.230.8-12.60.6494,
community_discussed_with.pngOther8.85.03.80.6559,
defensible_vegetation_activities.pngOther19.010.09.00.6628,
risk_barriers_to_mitigation.pngLack of community support21.430.0-8.60.6653,
risk_barriers_to_mitigation.pngLack of public support21.430.0-8.60.6653,
risk_concern_means.pngPoor air quality21.720.51.20.666,
hardening_reasons_not_made.pngOther31.424.47.00.6697,
risk_info_sources.pngOther27.338.5-11.20.6792,
preparedness_activities.pngHousehold emergency planning16.614.32.30.6847,
risk_experience_aggregate.pngLasting health effects1.32.4-1.10.6872,
hardening_reasons_not_made.pngNo financial means11.47.34.10.6968,
defensible_zone_actions.pngZone 0: Live plants removed within 5 feet88.992.7-3.80.6993,
community_favors.pngEveryday help (groceries, mail, trash bins)89.783.36.40.7199,
preparedness_activities.pngEmergency Go Bag & supplies13.211.31.90.722,
defensible_zone_actions.pngZone 1: Plants watered regularly89.587.52.00.7429,
risk_experience_aggregate.pngHeard about wildfire from others47.746.41.30.9111,
community_favors.pngCare (childcare, pet care, plant care)75.972.23.70.9617,
risk_experience_aggregate.pngNegative health effects15.916.7-0.80.9723,
hardening_upgrades_made.pngEnclosing eaves20.017.12.90.9751,
overview_age.pngmean age (bracket midpoints)61.860.51.30.9917,
overview_kpis.pngHas fire insurance96.293.13.11.0,
overview_kpis.pngComfortable in English100.0100.00.01.0,
defensible_vegetation_activities.pngThin shrubs 10ft from road/driveway52.455.0-2.61.0,
defensible_vegetation_activities.pngNo maintenance necessary9.510.0-0.51.0,
hardening_upgrades_made.pngRoof improvements45.743.91.81.0,
hardening_upgrades_made.pngSignage / address numbers45.743.91.81.0,
hardening_upgrades_made.pngVent improvements (ember-resistant)42.941.51.41.0,
hardening_upgrades_made.pngWindow improvements42.941.51.41.0,
hardening_reasons_not_made.pngNone of the above17.114.62.51.0,
hardening_reasons_not_made.pngHOA maintains exterior structures14.312.22.11.0,
hardening_reasons_not_made.pngDidn't know it was a problem8.69.8-1.21.0,
hardening_reasons_not_made.pngPrefer not to answer2.92.40.51.0,
risk_neighbor_perceptions.pngWorrying Partners51.453.7-2.31.0,
risk_info_sources.pngSubscribed alert service / app54.553.80.71.0,
risk_info_sources.pngInternet / news website36.438.5-2.11.0,
risk_info_sources.pngSirens9.17.71.41.0,
risk_info_sources.pngRadio announcement0.07.7-7.71.0,
risk_info_sources.pngBillboard / road message board0.07.7-7.71.0,
risk_barriers_to_mitigation.pngAesthetics28.630.0-1.41.0,
risk_barriers_to_mitigation.pngAccess to gardening/landscaping help21.420.01.41.0,
risk_barriers_to_mitigation.pngLack of education on strategies14.320.0-5.71.0,
risk_barriers_to_mitigation.pngLow perception of risk14.310.04.31.0,
risk_barriers_to_mitigation.pngLack of communication7.110.0-2.91.0,
community_discussed_with.pngPrefer not to answer0.02.5-2.51.0,
Note. Percentages use valid responses to each item; denominators may vary. Source: EMPOWER Santa Barbara Wildfire Preparedness Survey.